Nodes are the essential building blocks in the Advanced interface to the Poser Material Room. They are the graphical representation of mathematical function calls, that is: calculation procedures which turn parameters (inputs) to a result (output).
Advanced
The nodes from the Variables group tell me about the position, in space and time, of the spot that the PoserSurface definition is constructed for. There are two kinds of results from these nodes:
- Single values.
- Three value ‘vectors’. Like a color is defined by (Red, Green, Blue), so is a point in space defined by (X,Y,Z) and so on. These are discussed in previous articles on place P and normal N, and on stretching dPdu, dPdv, and in this article (curvature dNdu, dNdv)
The four Variables mentioned last tell us about the shape of the object, and the mapping that comes with it. The last two of these, dNdu and dNdv, look at variations in the surface Normal. When that varies a lot in a small step in U or V direction, it means that the surface is much curved. When it hardly varies, and all components of such a vector are close to 0, the surface is pretty smooth and flat. Yes, curvature is a vector too. I might have a lot in one direction, and hardly some at another. Do note that curvature is not slope. Slope is indicated by the normal at the point of interest, curvature is the rate of change in that slope.
Visualization
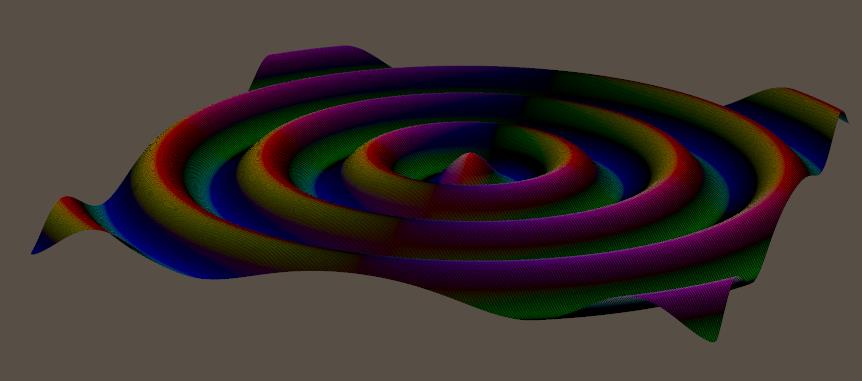
These renders show dNdu, translated to colors:

When it’s much curved, the colors are intense. Just before and after the tops, and just before and after the valleys. When it’s straight, either skewed or flat, the colors are mixed and dimmed. At the top and in the valley, but also halfway at the flanks.
Why do we get those colors? Let’s take the first case, start in the middle and gently walk to the right, the positive U direction. All normals will point up then, with no inclination forward or backward. This implies that two adjacent normals will have the same Z-value (being 0.0 in this case), so any difference between them will be 0 in Z-direction. When the resulting XYZ vector then is interpreted as a RGB color, it will show no Blue. For walking in that positive U direction, that is.
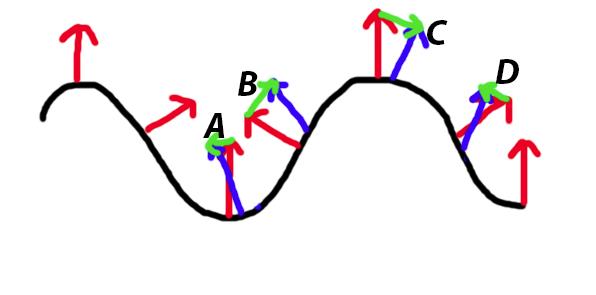
Meanwhile, the normal vector is UP at the lowest position, then leaning backwards (X negative, Y positive) when going uphill, then going straight UP again at the highest position, then leaning forward (X positive, Y positive) when going downhill, and then straight UP again. See the red and blue vectors in the illustration below:

The blue normals are exaggerated a bit, to illustrate the next point: while walking over the top half of the hill (B and C), the normal will lean less backward (B), and then more forward (C). So the difference (green arrows) between those adjacent normals is upwards to the right (B) and then downwards to the right (C). But while walking over or into the valleys (A and D) the normals lean backward more and more. So the differences between adjacent normals is to the left, downwards (A) or upwards (D).
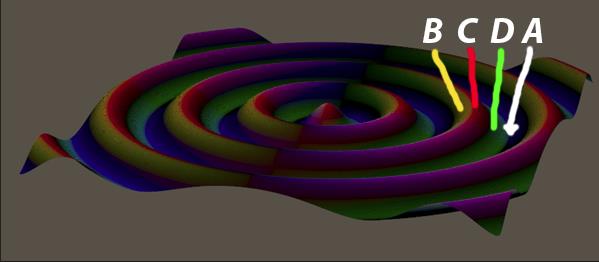
Translating this to colors, what can we expect?
A. downwards left: negative X (left), negative Y (down) and zero Z. The negatives are clipped to 0 when turned into colors, so the result is RGB = (0,0,0) aka Black.
B. upwards right: positive X, positive Y, and zero Z. That makes Red + Green + no Blue => Yellow.
C. downwards right: positive X, negative Y, zero Z makes Red + no Green + no Blue => Red
D. upwards left: negative X, positive Y, zero Z makes no Red, Green, and no Blue => Green.

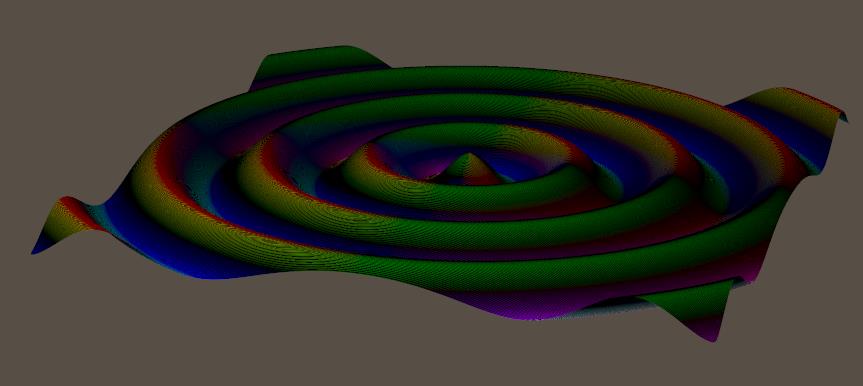
I leave dNdv to you:

Note that you’ve got to walk to the back, the positive V direction, which makes Z increasingly negative while X remains 0.